QUESTIONS BEFORE YOU JOIN
Know exactly what you get.
Clear answers about the premium indicator collection, AI tools, alerts, markets, access, billing, and risk.
What do I receive with my membership?+
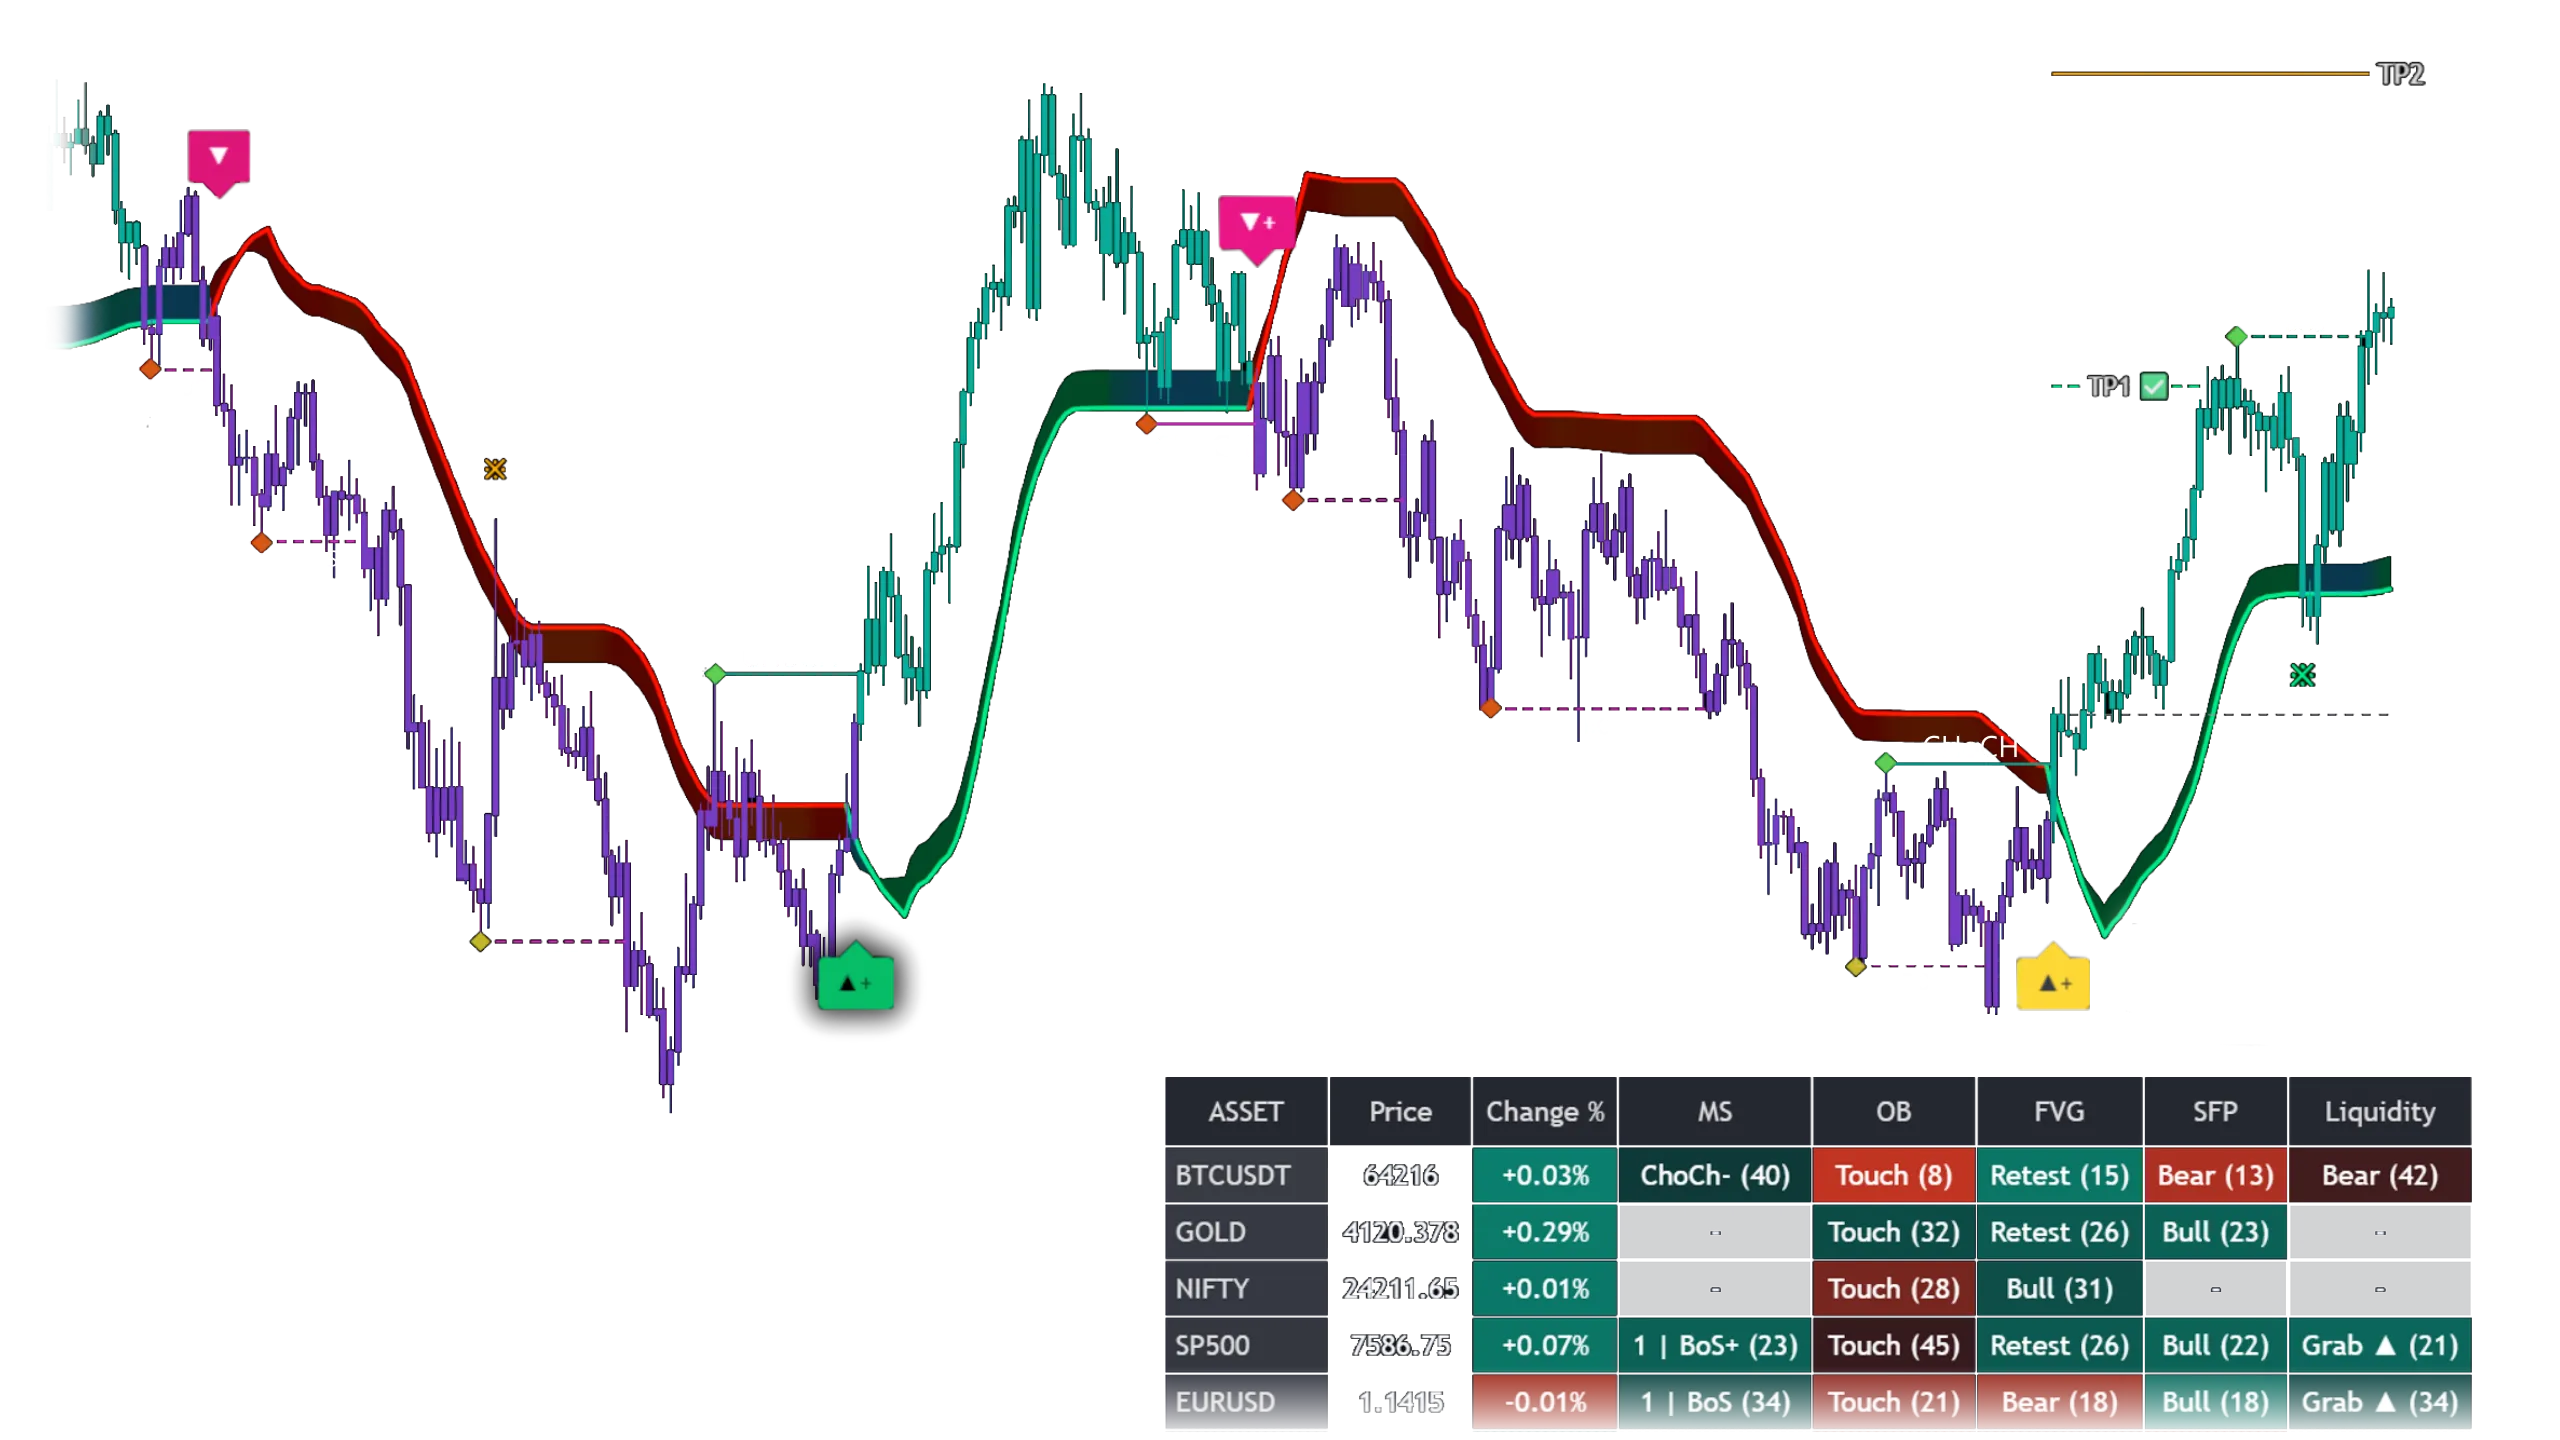
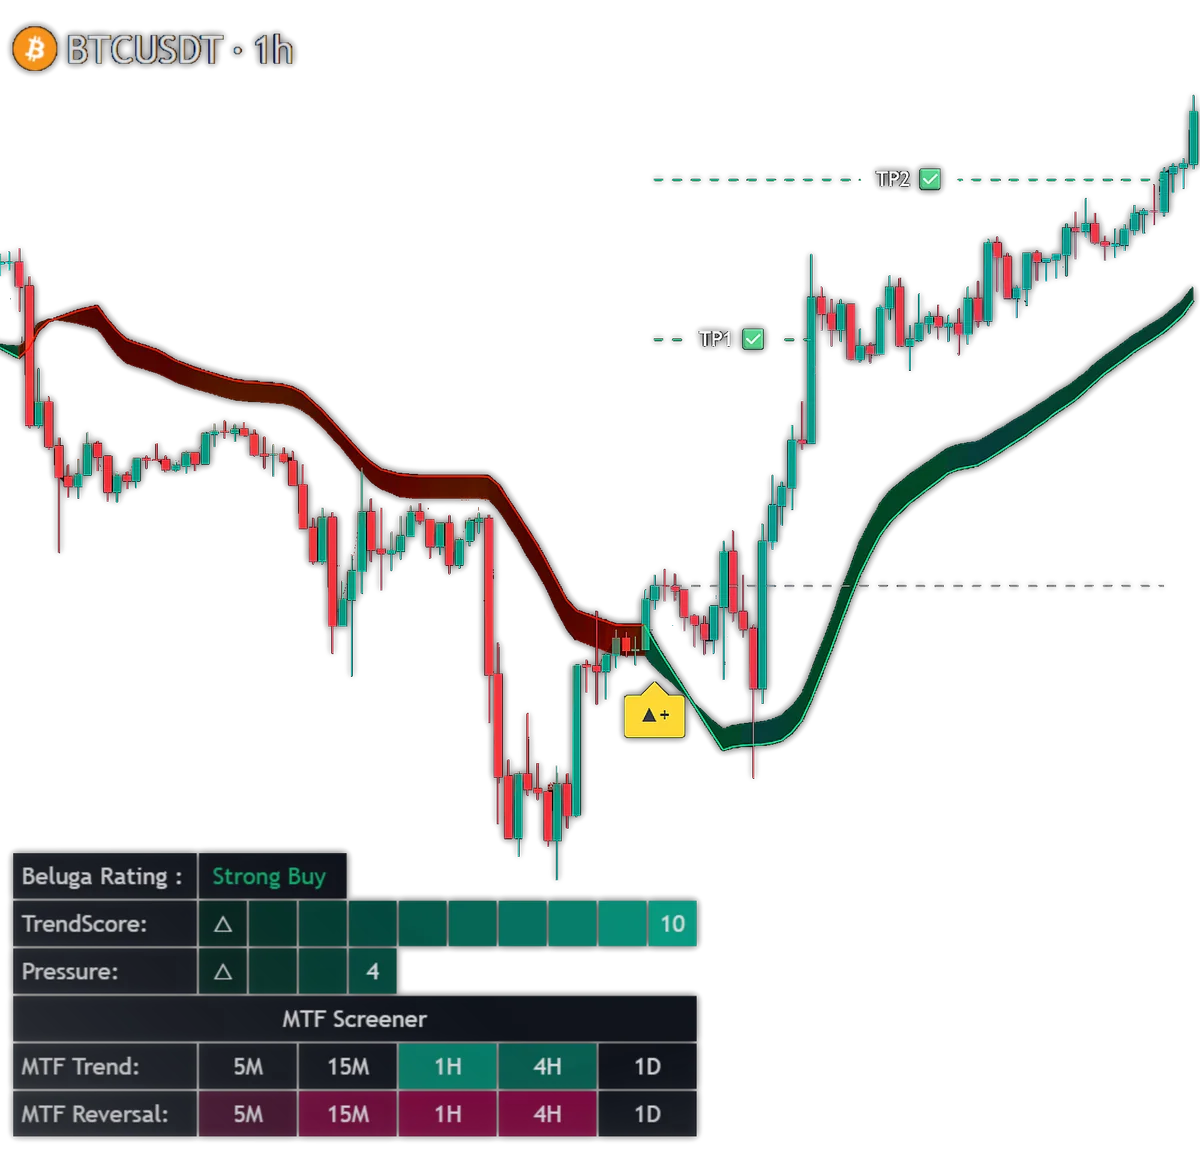
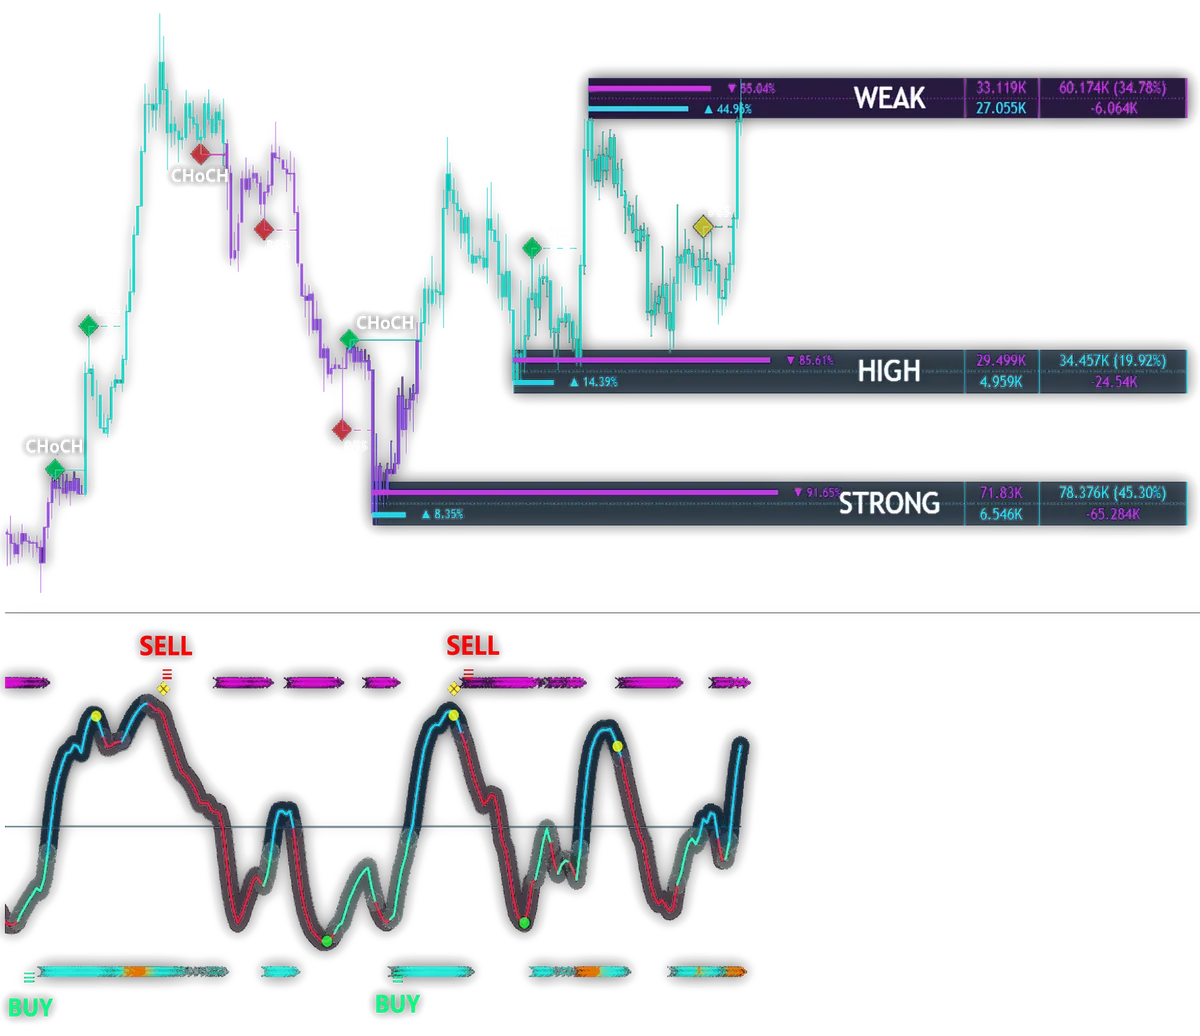
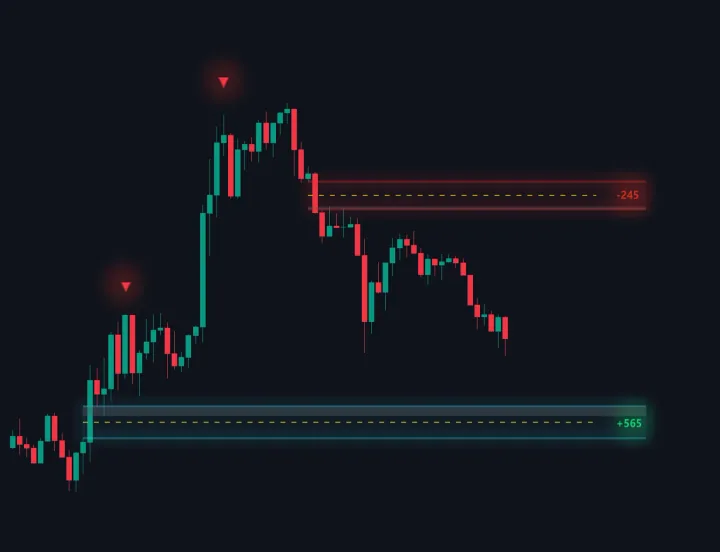
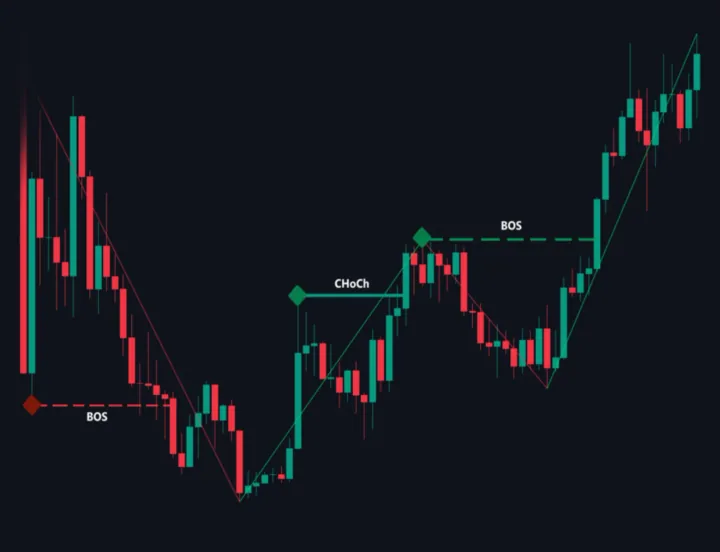
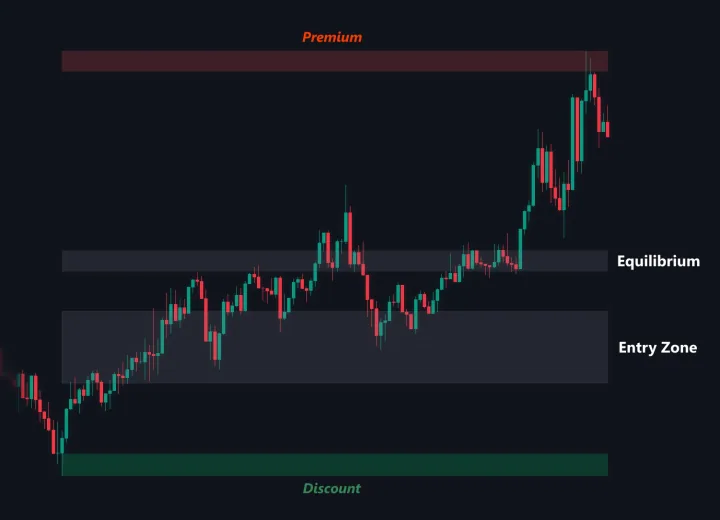
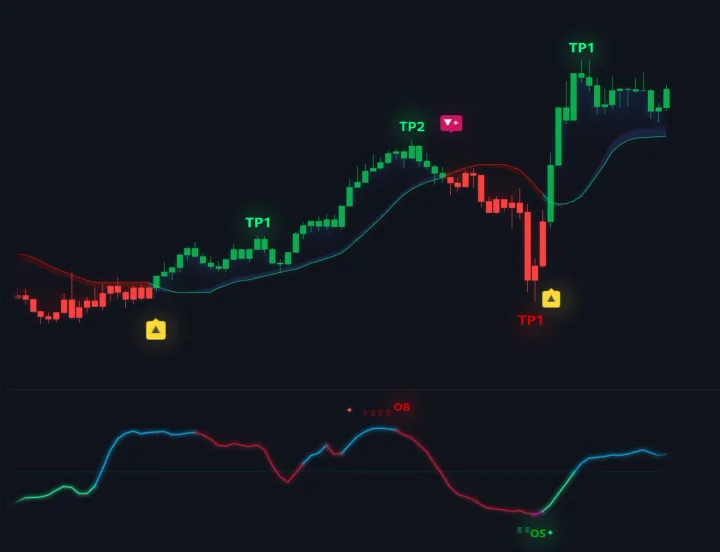
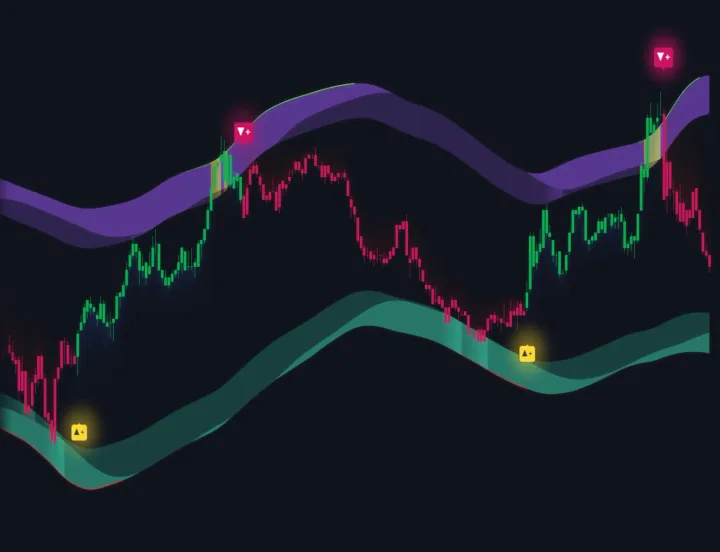
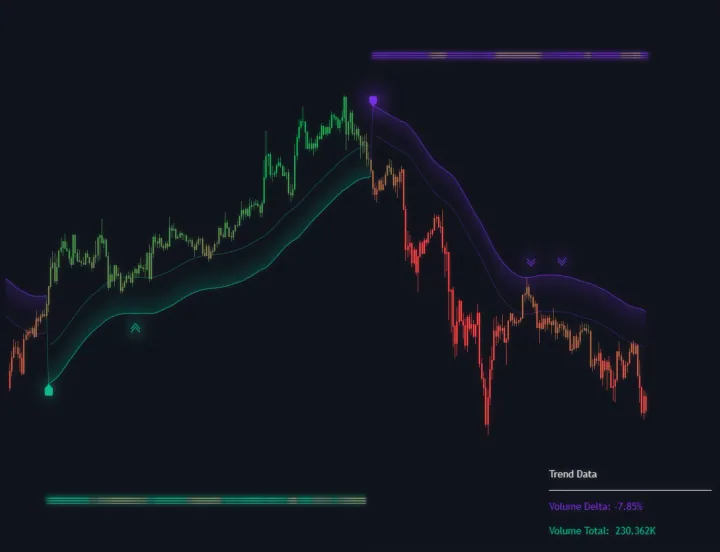
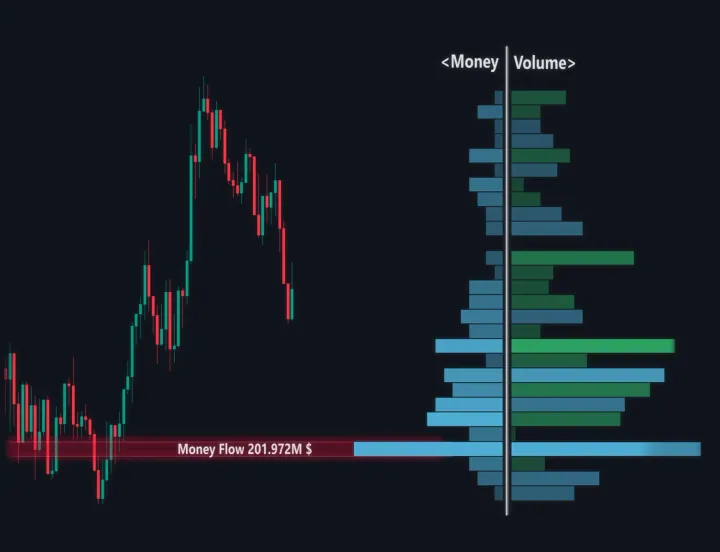
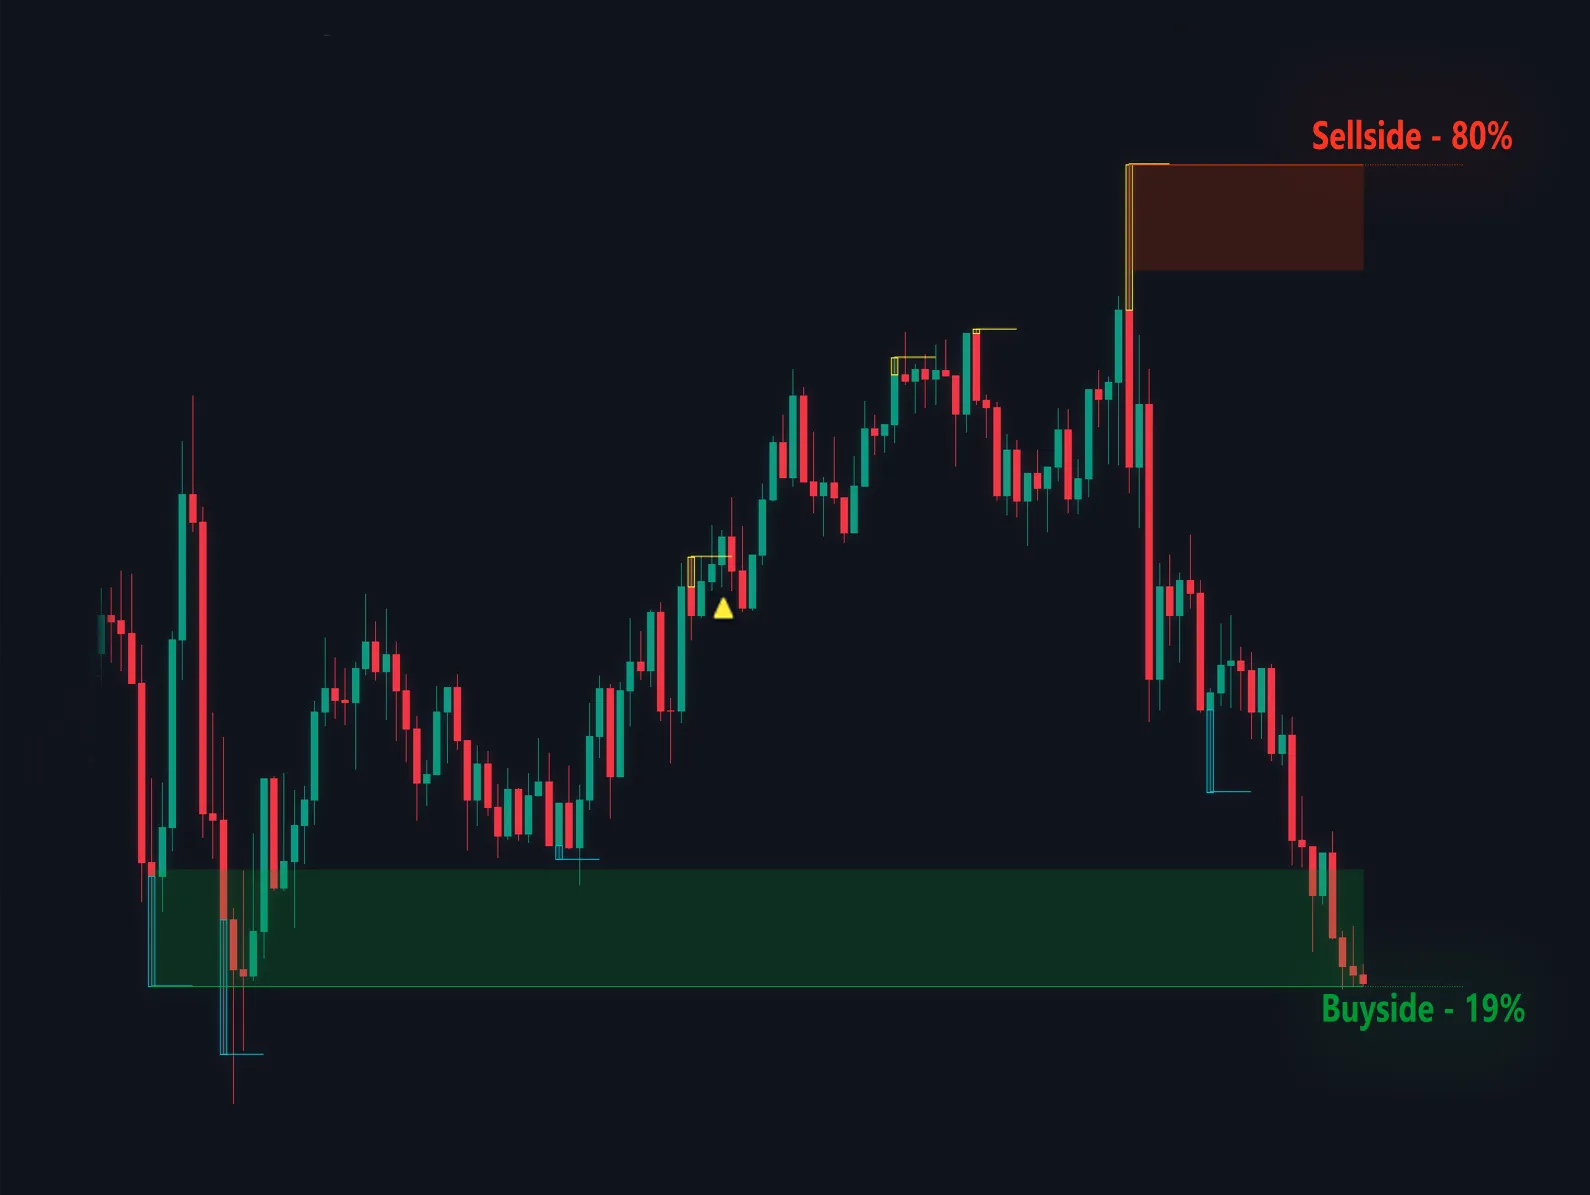
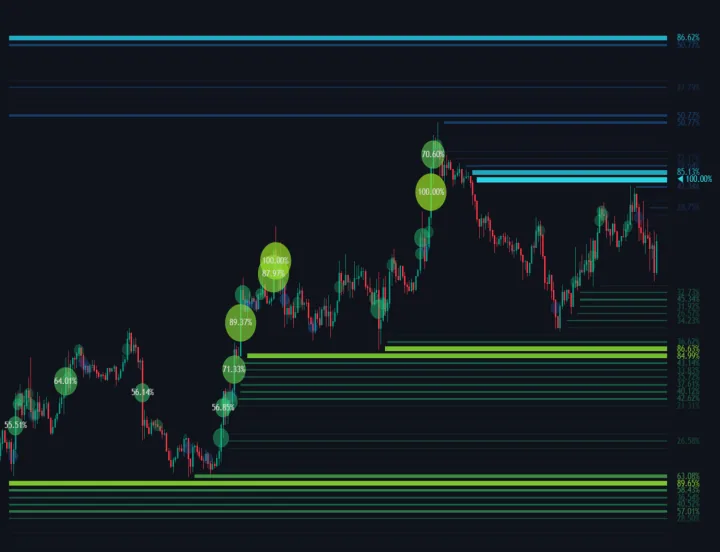
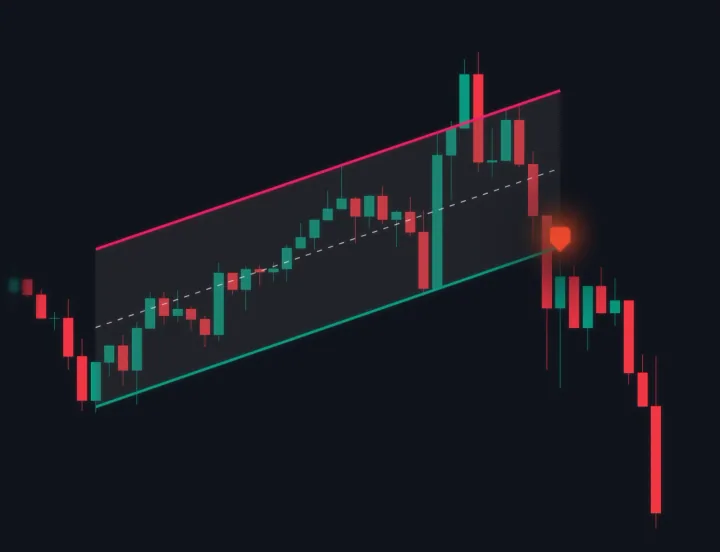
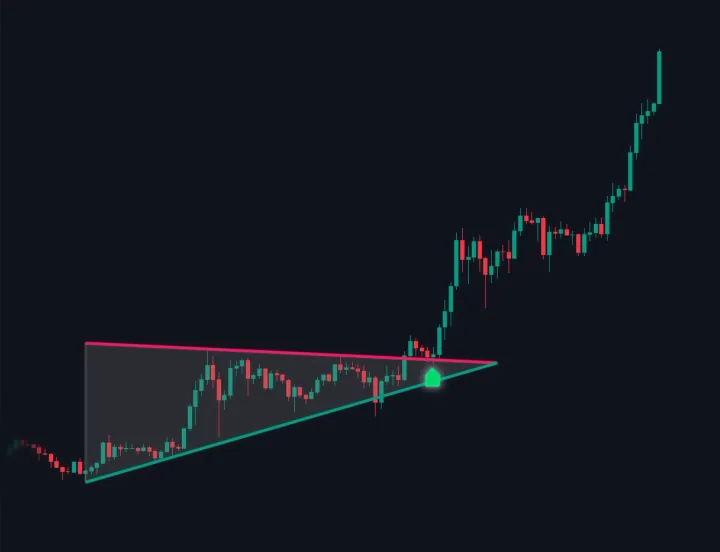
Every plan unlocks the premium TradingView indicator collection shown on this page. That includes BUY and SELL signals, take-profit and stop-loss levels, trend direction, dynamic support and resistance, liquidity, structure, momentum, pattern tools, and TradingView alerts. You also receive the complete AI toolkit with AI Chart Analyzer, Live Chart Analysis, Chart Copilot, Guardian risk controls, and position sizing.
How do I access the indicator after purchase?+
Pay without signing up first. After payment, verify your checkout email on the access page, then open the indicator area in your Pro dashboard. From there, open the current TradingView indicator and select “Use on chart.” Setup instructions are included.
How do the indicator and AI tools work together?+
The indicator displays signals, trend context, and trade levels on TradingView. The AI Chart Analyzer is a separate tool in your TradeStreamAI dashboard: upload a screenshot when you want a BUY, SELL, or WAIT assessment with reasoning and risk context. Neither tool places trades for you.
Which AI and risk tools are included?+
Your membership includes AI Chart Analyzer for screenshot analysis, Live Chart Analysis across 70 supported markets, Chart Copilot for follow-up questions, and Guardian tools for risk limits and position sizing. They are included alongside the premium TradingView indicators.
Can I receive alerts on my phone?+
The indicator supports TradingView alerts. Where those notifications arrive depends on the alert and notification options available and enabled in your own TradingView account.
Does it show take-profit and stop-loss levels?+
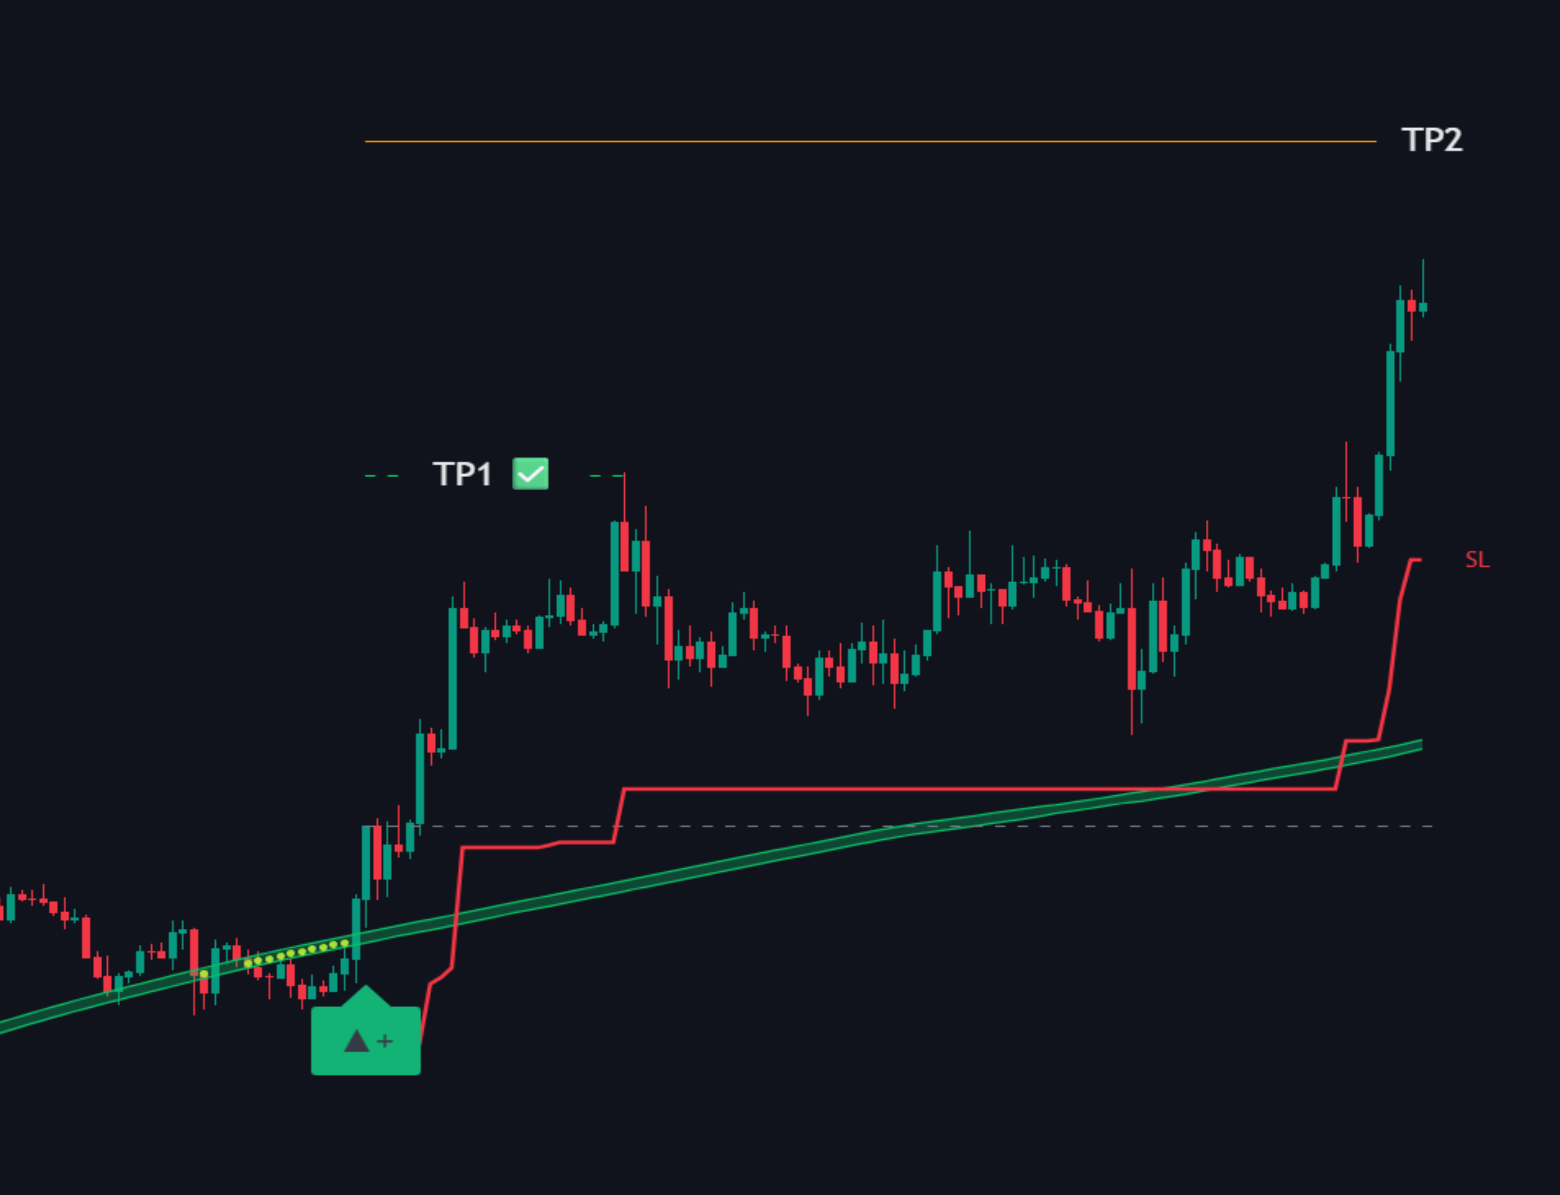
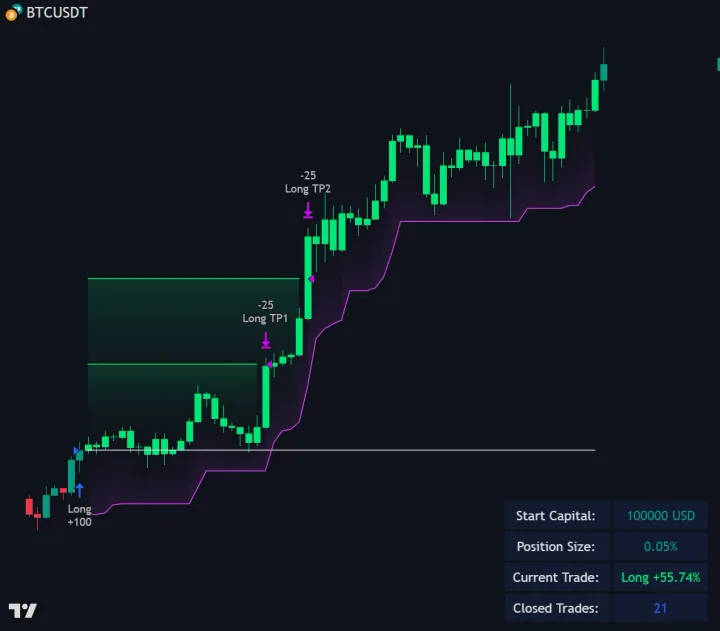
Yes. The indicator includes structured take-profit and stop-loss levels alongside its setups. These are analytical reference levels, not automatic orders, and you should independently verify them before trading.
Which markets can I use it on?+
You can add the indicator to TradingView charts across Forex, crypto, gold, indices, stocks, and commodities. Signal usefulness can vary by market, timeframe, volatility, liquidity, chart type, and settings.
Can I cancel my subscription?+
Yes. Cancel a monthly or 3-month card subscription from your TradeStreamAI account or Whop billing portal. You keep access through the paid period and will not be charged again after cancellation. The 1-year plan and crypto purchases are one-time payments without automatic renewal.